The Hashpoint Special Edition: Every Theory, Side by Side
· Dennis W. Davis
Bitcoin Hashpoint, October 15, 2026, 7:00 PM Eastern

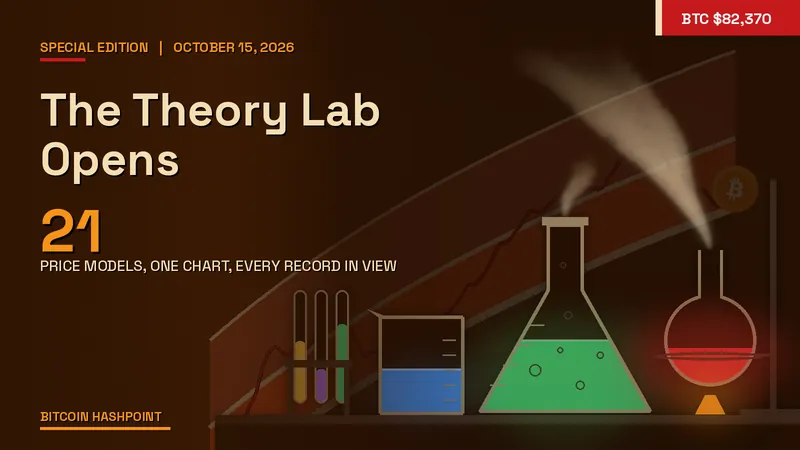
Every major bitcoin price theory now sits on one chart in the Hashpoint Theory Lab, and every one of them carries its track record on the same page.
Few assets have collected as many price theories as bitcoin. Power laws, stock-to-flow, halving cycles, realized price, mining cost, the options market: each has its believers and its target. Each usually reaches a reader alone, on a chart its own fans drew, without the misses.
The Lab turns that around. It puts 21 models on one set of axes, lets anyone switch every line and band on or off, and grades every model on one test. Nobody gets to hide a bad year.
Why build it
A single theory makes a clean story. The power law draws a straight line through fifteen years of log prices. Stock-to-flow ties value to the shrinking flow of new coins. The halving cycle lays one four-year pattern over the next. Realized price tracks what holders actually paid.
Each of them explains part of the record. None of them explains all of it, and the disagreements between them say as much as the agreements. When the trend lines, the holder-cost lines and the mining-cost lines all crowd near one price, that price means something. When they scatter, the honest reading is that nobody knows.
You cannot see that by reading one chart at a time. You can see it when they share the axes.
What is in it

The Lab groups its 21 models into families, so that ten variations on one idea cannot pass for ten independent opinions.
| Family | Models | What it reads |
|---|---|---|
| Trend fits | Power law, Rainbow bands, log growth curves | Price against time on log scales |
| Cycle | Halving replays, Pi Cycle | Lays each four-year cycle over the next |
| Scarcity | Stock-to-flow | Value from the stock of coins against new supply |
| Adoption | Capital S-curve with FOMO | Committed capital moving up an adoption curve |
| Price structure | Mayer multiple, 200-week average | Price against its own long averages |
| Holder cost | Realized price and MVRV, thermocap | What holders paid, and what miners earned |
| Network | NVT, Metcalfe | Value against use and users |
| Mining cost | Production cost, difficulty regression, energy value, hash ribbons | The cost to make a coin |
| Market-implied | Options, futures, prediction markets | What traders pay for the year ahead |
| Scenario | Wealth share | A what-if slider: on the chart, out of the median unless a reader adds it |
Every model breaks into its parts. The power law alone carries a floor, a median, a ceiling and an extreme band two standard deviations out. The Rainbow carries ten bands. In all, the Lab holds 56 separate pieces in 23 sets, and each one has its own switch.
How it keeps score

The test is the same for everyone. At each of 128 month-ends, the Lab asks what every model would have said using only the data available that day, then compares the answer with where bitcoin actually traded 30, 180 and 365 days later. Analysts call this a walk-forward test. It stops a model from grading itself on data it had already seen.
The combined line, the Model median, gives each family one vote. A family with ten bands gets the same say as a family with one line.
That median misses bitcoin's actual price by 27.6 percent at 30 days, 31.6 percent at 180 days and 41.2 percent at a year, on the median month. The Lab prints those numbers at the top of the page, not in a footnote.
One rule keeps a broken model out. Any model whose miss at a year runs past 100 percent stays on the chart but loses its vote in the forward median. Stock-to-flow, the best-known bitcoin model of the 2021 cycle, misses by 112.8 percent at a year, so it stays visible and does not count.
What the Lab reads now
On the October 14 close of $81,570, the Lab's family median stood at $94,620, with the middle half of the families between $76,280 and $103,400. Seven of the ten families cast a vote on that close. Scarcity sits out under the 100 percent rule, Scenario stays out unless a reader adds it, and the Market-implied family votes only on dates past the last close. Bitcoin traded about 14 percent below the median of its own theories.
The options market tells a different story. In the October 15 snapshot, Deribit's options expiring September 24, 2027 put the middle half of outcomes between $64,020 and $103,100.
The two do not really disagree, because they answer different questions. The models ask where value has sat, given the record. The options price what traders will pay to insure against the next year, and that pricing centers near today's price by construction. A gap between them measures the distance between the record and the market's caution, not a forecast from either side.
Playing with it

The Lab opens with a row of sets. One click shows everything or clears it. Another loads a family: Power law, Cycles, Scarcity, On-chain value, Mining cost or Market-implied. Floors only lines up every model's idea of a bottom. Ceilings only does the same for tops.
Each set has one master switch that reads all, some or none. Open the set and every piece inside it gets its own switch. Add the power law's extreme band, drop the Rainbow's top three bands, keep the realized price and lose the MVRV lines. A reader can build any mix and save it under a name.

The Ledger lists all 56 pieces in one sortable table: today's value, the distance from the price, the track record and whether the piece votes in the median. A search box finds any of them.

The Gallery draws every model as its own small chart against the real price, all at once. Click one and it joins the main chart. On a wide monitor the whole wall fits on one screen.
Every setting rides in the page's link. Build a view, copy the link, and the next person sees exactly what you saw.
What it is not
The Lab is not a forecast, and it says so on every screen. Its best combined line still misses by about 41 percent a year out on the median month. That number is the point. A theory that cannot beat its own record has no business setting a target, and the Lab puts the record next to the target.
The next step raises the bar. A Consensus Curve will weight each model by its walk-forward record and test the result against the simplest rival of all: the assumption that the price a year from now equals the price today. A model that cannot beat "no change" will earn no weight, and the Lab will say so.
The Hashpoint read
Bitcoin's price theories have spent fifteen years talking past each other on separate charts. On one chart, with one test, they look less like prophecies and more like instruments, useful in some seasons and wrong in others. None of them has a record good enough to trust alone.
That makes the agreements worth watching. On the October 14 close, the middle half of the families ran from about $76,000 to $103,000 while bitcoin traded near $82,000. That is a structural read of where the record says value has sat. What the price does with it is the market's business.
Open the Lab, switch everything on, then switch it all off and build your own. The record is on the page.
Data: Bitcoin Hashpoint Theory Lab, dashboard.bitcoinhashpoint.com/lab (21 models in 10 families; 56 components in 23 sets; family-weighted Model median and its 25th to 75th percentile range; walk-forward scorecard over 128 month-ends, median absolute error at 30, 180 and 365 days; the 100 percent exclusion rule and stock-to-flow's 112.8 percent error at 365 days; the extreme power-law band from the Uber fit's two standard deviation bounds), figures as of the October 14, 2026 close, refresh on publication; Deribit public options data (September 24, 2027 expiry, 25th to 75th percentile of the implied distribution, October 15, 2026 snapshot); Bitcoin Hashpoint dashboard (BTC close of $81,570 on October 14, 2026). Structural reads, not forecasts. Nothing here is investment advice.
Get the Hashpoint by email twice a week, Wednesday and Saturday: subscribe free, one click to unsubscribe.