
Reading the $1 Billion Outflow Week
ETF flows reversed sharply in the second week of May. The reversal reveals something durable about the nature of institutional demand in 2026. It amplifies, but it does not lead.

ETF flows reversed sharply in the second week of May. The reversal reveals something durable about the nature of institutional demand in 2026. It amplifies, but it does not lead.
The eleven U.S. spot Bitcoin ETFs launched in January 2024 with the explicit promise of institutional permanence. Here, finally, was a regulated, custodied, fee-bearing vehicle through which traditional capital, pension funds, endowments, family offices, wealth management platforms, could access Bitcoin without operational friction. The category's rapid growth through its first year appeared to confirm the thesis. By early May 2026, cumulative net inflows had crossed $58 billion.
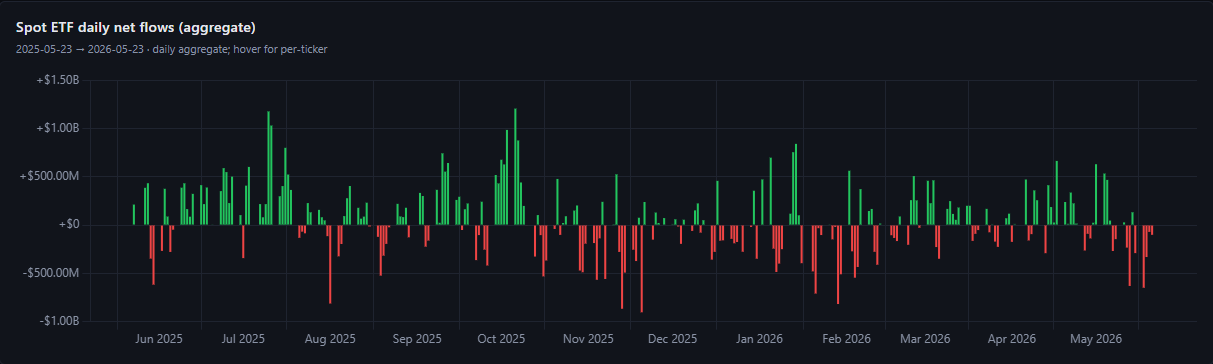
Then, in eight trading days, the category produced a net $1 billion outflow. May 13 alone accounted for $635 million of that figure, the largest single-day net outflow since late January. CoinShares, which tracks weekly flows across digital asset investment products globally, reported the largest weekly outflow of 2026 across the entire category, with Bitcoin ETFs responsible for nearly all of it.
What the mainstream explanation misses
The dominant narrative in financial media attributed the outflow week to Iran-related geopolitical risk and elevated oil prices. Both were real factors in the broader risk-off sentiment that characterized mid-May markets. But neither alone, nor both together, is sufficient to explain a billion-dollar reversal across a category that had been running six consecutive weeks of positive inflows.
A sharper explanation emerges from examining the composition of ETF demand, not just the aggregate direction. The inflows of late April and early May were not driven by new, long-term strategic allocators putting Bitcoin into 60/40 portfolios. They were driven substantially by momentum-positioned capital: traders and allocators who saw a recovering Bitcoin price and incoming inflow data and positioned for continuation. When the CPI print arrived on May 13 and forced the macro repricing described in the previous piece, those positions had an obvious logical conclusion. Exit.
This is what "reactive demand" looks like in practice. The capital was real. The institutions were real. The ETF infrastructure is real. But the decision-making frame behind the inflows was "this is going up, get in" rather than "this is a twenty-year strategic allocation." When the first frame broke, the outflow followed mechanically.
The amplification function
There is a durable structural insight here that matters for how we read ETF flow data going forward.
ETF flows in 2026 function primarily as amplifiers, not initiators. They magnify price trends, upward in periods of momentum, downward in periods of reversal, but they do not create the trends themselves. The underlying drivers of Bitcoin's price trajectory remain the same as they have always been: the halving-driven supply schedule, the marginal-buyer picture (which Strategy has dominated in 2026), the macro environment for real yields, and the cycle position relative to the historical power-law envelope.
The ETF category sits on top of those drivers as an amplification mechanism. When the fundamentals are positive and the price is trending upward, ETF flows pile in and steepen the slope. When the fundamentals create uncertainty and the price stalls or reverses, ETF flows exit and steepen the decline. They are a multiplier, not an independent variable.
This has important implications for how to read the data. Treating ETF inflows as a leading signal, as though they represent a durable new source of structural demand independent of price action, has the causality backward. The inflows follow the price. They do not drive it.
The institutional hierarchy in 2026
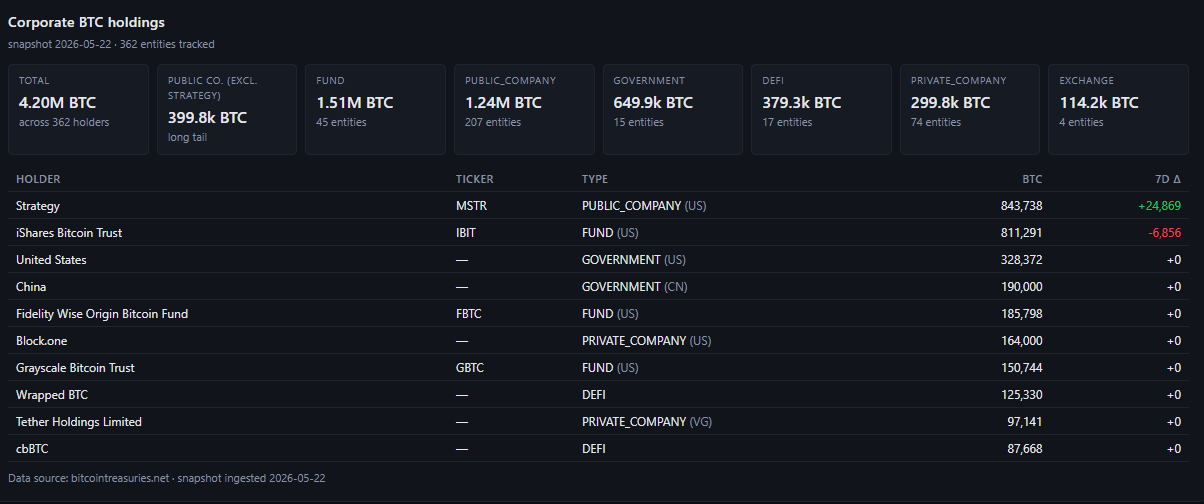
The ETF category produced approximately $58 billion in cumulative net inflows through early May 2026. That is a large number. It is also, when compared to Strategy's deployment through STRC alone, roughly $5.58 billion year-to-date, a reminder that the institutional picture is not uniform.
BlackRock's IBIT holds approximately 579,000 BTC as of recent filings, making it the largest single ETF holder. Fidelity's FBTC holds roughly 190,000 BTC. Together, the eleven ETFs represent somewhere north of 1.1 million BTC, or approximately 5.5% of total Bitcoin supply.
That is structural significance in the long run. In the short run, the week-to-week dynamics that produce a $1 billion outflow, those holdings move in response to price signals and macro conditions rather than driving them.
What we watch for the week of May 25
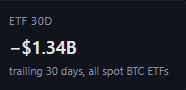
ETF flow direction is the most visible and frequently updated data point in Bitcoin's institutional demand picture. The dashboard's ETF 30D card updates daily and provides the cleanest trailing read on whether the category is in net-accumulation or net-distribution mode.
The specific threshold worth monitoring in the coming week is whether daily flow turns positive and sustains for three or more consecutive sessions. A single day of inflows after a week of outflows is noise. Three consecutive positive days is the beginning of a trend signal. Five consecutive positive days would suggest the late-April inflow regime is attempting to reassert itself.
The macro configuration, with the April CPI print still fresh and rate-hike probabilities elevated, is not currently supportive of a rapid return to the late-April inflow pattern. But ETF flows can surprise. The data is the data, and we will read it as it arrives.