The Hashpoint for July 2, 2026
· Dennis W. Davis
Bitcoin closed at $59,961 on July 1, a hair above its modeled power-law floor. The daily tape was green. The structure underneath it was not. Across the first half of 2026 the market has run on an institutional bid built from three engines: Strategy's issuance-funded accumulation, spot-ETF inflows, and a lengthening tail of corporate treasuries. On July 2 all three read cold at once, and the clearest cause traces back to a single instrument trading twelve dollars below par.
The summary
Price sits at the base of the modeled range. The power-law read puts cp at 0.0027, which places the July 1 close of $59,961 just above the $59,638 floor and about $82,000 under the $141,996 median. A market at its floor is not a market in trouble by itself. What matters is why it is there, and the answer this week is a demand air pocket rather than a supply shock.
Strategy has effectively stopped buying. The company holds 847,363 BTC against a $64.1 billion cost basis, but its most recent filing reports zero coin acquired for the June 22 to June 28 window, and only 3,657 BTC across the trailing thirty days. Set that against the 22,000 to 34,000 BTC weekly prints the same firm was posting in March and April, and the deceleration is not subtle.
The instrument explaining that deceleration is STRC. Strategy's variable-rate perpetual preferred closed at $87.46, twelve dollars and change below its $100 par, with its at-the-market issuance state reading closed and no days above par in either the last week or the last month. The dividend has ratcheted to a 12% declared rate effective July 1, while the rate actually paid still reads 11.5%. That gap is the whole story, and it is worth its own section below.
The other demand channels agree with the direction. Spot ETFs posted three consecutive outflow days totaling $749.6 million over five sessions. The dashboard's raw supply-pressure estimate sits at -5.07, built on net institutional thirty-day flow of -68,421 BTC against 13,500 BTC of new issuance. On the other side of the ledger, the offsets are real but light: Metaplanet added 2,823 BTC in seven days, volatility is calm with VIX at 16.45, and real M2 growth runs about 1.41% ahead of the hard-money baseline. Macro is supplying a soft floor. It is not supplying a buyer.
| Reading | Value | Structural note |
|---|---|---|
| BTC close (Jul 1) | $59,961.45 | +2.46% vs Jun 30; noise inside a 58k–60k range |
| Power-law floor / median / ceiling | $59,638 / $141,996 / $425,987 | Price at the floor band |
| cp (cycle position) | 0.0027 | Base of the modeled range |
| Strategy holdings | 847,363 BTC | 3,657 acquired in 30d; 0 in latest week |
| STRC close vs par | $87.46 (−$12.54) | ATM closed; issuance bid inactive |
| STRC dividend | 12% declared / 11.5% paid | Escalator climbing on the monthly lag |
| ETF flow (5d) | −$749.6M | Three consecutive outflow days |
| Net institutional 30d | −68,421 BTC | Raw SPI −5.07 vs +13,500 issuance |
| Real 10Y yield | +0.27% | 4.44% nominal − 4.17% CPI; mildly restrictive |
| DXY / VIX | 120.89 / 16.45 | Elevated dollar, calm volatility |
Price and power-law position
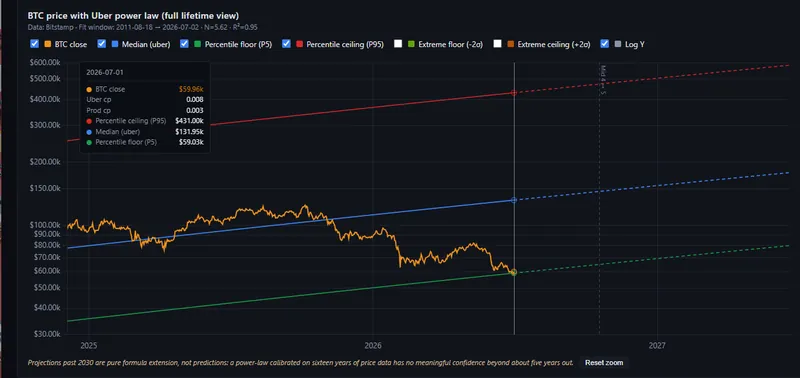
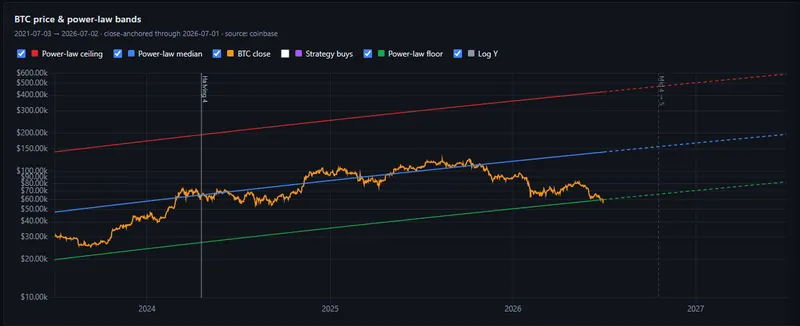
The close came in at $59,961, up 2.46% from the June 30 print of $58,523. Read across the week and the bounce loses its meaning: the last five closes ran 59,935, 59,474, 60,163, 58,524, 59,961. That is a market oscillating in a narrow band at the bottom of its structural range, not one setting a direction.
The floor itself sits at $59,638 today, which is the number that matters. Price is holding roughly $300 above it. The power-law model has never treated the floor as a hard support, only as the lowest band the historical relationship has occupied, so proximity to it is a statement about where reward and risk sit in the modeled range, not a signal that a bounce is owed. The median at $141,996 is a long way up. The distance between spot and median is the plainest single measure of how far the current tape sits from the center of its own history.
The alternate "uber" parameter set, which fits the envelope on a different calibration, reads close to the primary model this week: a $59,027 floor, a $131,948 median, a $431,002 ceiling, cp at 0.0079. Two independent fits placing price at the floor is a firmer read than either alone.
The Strategy bid has stalled
Strategy sits at 847,363 BTC. The cumulative line has gone flat. The June 29 filing, covering purchases through June 28, records no coin bought at all, and the trailing month totals 3,657 BTC. Walk the cadence backward and the shape is a deceleration, not a pause: 1,550 in the first week of June, 1,587 in the second, 520 in the third, then nothing. Compare that to the firm's April, when single weeks brought 34,164 and 13,927 BTC. The engine that added more than a quarter-million coins across the first four months of the year has idled.
This is not a company that has lost interest. It is a company that has lost, for now, the funding channel that let it buy on this scale. That channel is STRC, and understanding why it closed is understanding this entire edition.
STRC and the escalator lag
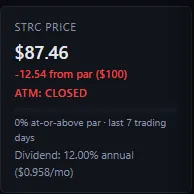
STRC is Strategy's $100-par perpetual preferred, built with a variable monthly dividend meant to hold the stock near par. When it trades at or above $100, the at-the-market mechanism is economically live: the company issues fresh preferred and routes the proceeds into Bitcoin. When it drifts below par, that issuance stops making sense, because selling a hundred-dollar claim for eighty-seven dollars to buy coin is a losing trade for the balance sheet. On July 1 STRC closed at $87.46, and the ATM state reads closed. The bid is off at the source.
Here is the part worth stating plainly, because it is the structural insight this publication has been tracking since STRC launched. Rising bond yields pull capital out of Bitcoin and out of the preferred alike, which pushes STRC below par. The below-par condition triggers the instrument's own defense: the dividend escalates to draw the price back toward $100. That escalation is exactly what raises Strategy's cost of funding, which throttles the pace at which the company can accumulate. The mechanism that protects the preferred holder is the same mechanism that chokes the Bitcoin bid. Demand does not fall because sentiment soured. It falls because the funding instrument is doing precisely what it was designed to do under stress.
And the escalation carries a timing flaw that this week puts on display. STRC reprices monthly, not daily. The board has declared a 12% rate effective July 1, but the rate the market has actually received still reads 11.5%, anchored to the last full monthly coupon of $0.958 paid June 15. The first full distribution at the new 12% rate is scheduled for August 15. So the declared rate leads and the paid rate trails, and the whole apparatus lags the daily moves in bond yields that set the stress in the first place. The largest structured institutional bid in this market cannot keep pace with the very conditions that impair it. The dashboard card now shows both numbers side by side, 12% declared over 11.5% paid, so the gap reads at a glance.
The instrument that guards the preferred holder is the instrument that starves the Bitcoin bid, and it does so a month behind the yields that trip it. That lag is not a flaw in the data. It is the structure.
ETFs and the wider institutional tape
The spot funds tell the same story from a different seat. Three consecutive outflow days produced a five-day total of -$749.6 million, against a cumulative inflow base since launch of $50.9 billion. iShares still anchors the group at 811,291 BTC, with Fidelity's fund at 185,798 and Grayscale at 150,744, but the recent daily prints have turned red. When the ETF channel and the Strategy channel drain together, the market loses its two largest marginal buyers in the same window.
The corporate tail is broader and quieter. The tracked set spans 364 entities holding 4,191,770 BTC in total. Funds hold 1,508,311 of that, public companies 1,267,651, governments 649,947, and the long duration corporate tail excluding Strategy carries 420,288. Movement inside the tail this week was mixed: Metaplanet added 2,823 BTC over seven days, a genuine offset, while K Wave Media exited its position entirely. Governments continue to sit still, with the United States at 328,372 BTC and China at 190,000, neither moving. A long tail that holds but does not add is a floor, not a bid, which is the same conclusion the rest of the tape keeps returning.
The macro backdrop
The macro read is mixed and mildly restrictive on balance. The real 10-year yield sits at +0.27%, a nominal 4.44% against 4.17% CPI, which means fixed income is nominally outrunning inflation and giving capital a reason to sit in bonds rather than reach for duration in Bitcoin. Real M2 growth runs about 1.41% ahead of baseline, a modest hard-money tailwind that cuts the other way. Volatility is quiet, with VIX at 16.45. The dollar is heavy, with DXY at 120.89, a mild headwind for any dollar-priced asset.
One detail in the inflation print is worth holding onto. Headline CPI at 4.17% sits well above core CPI at 2.82%, which points to headline pressure coming largely from the supply and energy side rather than from broad demand. That distinction matters for how the Fed is likely to read its own data, and by extension for the path of the real yield that sets so much of the pressure on STRC.
Regulatory structure
Two items moved in the background over the past quarter, neither yet law. The CLARITY Act, H.R. 3633, cleared a second Senate committee in May 2026 and is advancing toward a Senate floor vote, carrying an institutional classification framework and bankruptcy protections that remain pending final passage. Separately, the American Reserve Modernization Act entered committee with bipartisan sponsorship, proposing a statutory U.S. Strategic Bitcoin Reserve. Both are slow structural inputs. Neither changes this week's flow picture, but both sit on the side of the ledger that widens the eventual institutional pipeline if they pass.
The horizon read
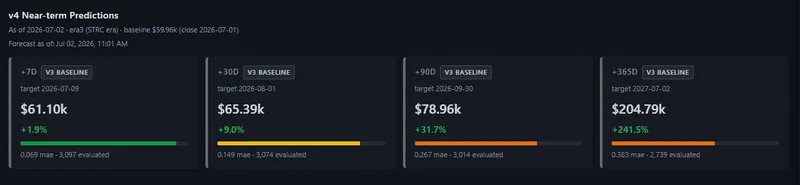
Treat the following as a structural read of where the modeled relationship points, not as a forecast. The router selected the era3 model, and the horizon medians read $61,103 at seven days, $65,385 at thirty, and $78,956 at ninety, with log-error bands that widen at each step. At the one-year mark the median prints $204,788, but the model's error at that horizon runs 0.38 in log terms, wide enough that the number carries no directional weight and should be read as a boundary of the modeled range rather than a target.
The more useful signal this week is disagreement, not level. The cross-era spread, which compares models trained on different market regimes, runs at 59% of current price at the thirty-day horizon and 194% at ninety days. At ninety days the ETF-era fit points to $131,898 while the STRC-era fit points to $15,404. When models built on different histories reach conclusions that far apart, the width of the gap is the message: the market is between regimes, and the size of that uncertainty is itself the read. It is a statement about how unsettled the structure is, not a call on direction.
What the structure says
The market is sitting on its floor because the marginal institutional buyer has stepped back, and the clearest single reason is mechanical. STRC below par has closed the issuance channel that funded Strategy's accumulation, the dividend escalator is climbing a month behind the yields that pushed the stock down, and the ETF tape has turned to outflows in the same window. Macro is holding a soft floor through calm volatility and hard-money M2 growth, but a soft floor is what keeps price from falling, not what makes it rise.
Two readings would change the picture, and both are worth watching into next week. The first is STRC itself: any sustained move back toward $100 par would signal the issuance mechanism can reopen and the Strategy bid can restart. The second is the ETF flow sign: a reversal of the outflow streak would mark the return of the other large buyer. Until one of those turns, the structure describes a market waiting on its own funding plumbing, priced at the bottom of its modeled range, with the switch held open by an instrument doing exactly what it was built to do.
The Hashpoint is structural analysis, not investment advice. Model outputs describe the modeled relationship between price and time; they are not predictions. Data pulled from the Hashpoint Dashboard, July 2, 2026.
Get the Hashpoint by email twice a week, Wednesday and Saturday: subscribe free, one click to unsubscribe.