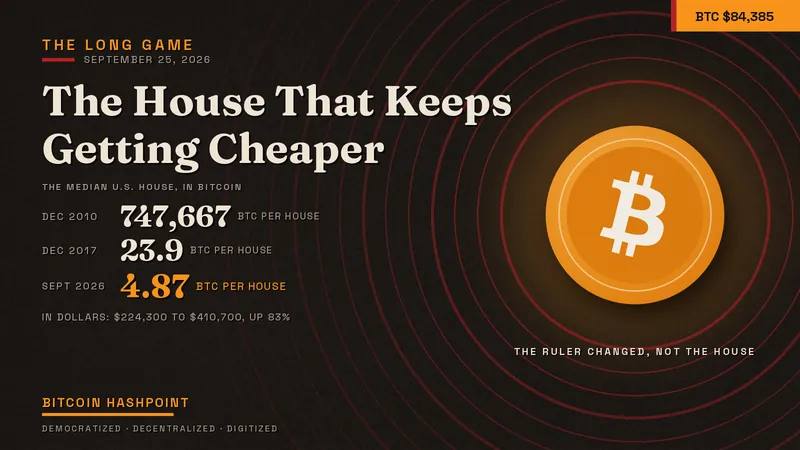
The Long Game: The House That Keeps Getting Cheaper
· Dennis W. Davis
The Long Game is the Hashpoint's essay series: the ideas that play out over decades, not days. Bitcoin Hashpoint, September 25, 2026

In July 2010, a median American house cost more bitcoin than existed.
On July 17 of that year, two strangers matched the first trade on the Mt. Gox exchange: 20 coins at $0.04951 apiece. The median U.S. house sold for $224,100 that quarter. Divide the house by the coin and you get 4.53 million bitcoin. The network had issued 3,438,650 at that hour. You could have owned every coin in existence and still come up more than a million short of a three-bedroom ranch.
This morning the same median house, $410,700 on the Census Bureau's latest quarterly read, costs 4.87 bitcoin at $84,385. In dollars, the house rose 83 percent in sixteen years. In bitcoin, the house fell roughly 930,000-fold. Same house, same country, same sixteen years, two measuring sticks, and the sticks disagree about the direction of the answer.
This edition asks why. The answer runs straight through the economic theory that has governed the dollar since the Second World War, and through a claim that theory has spent ninety years trying to disprove: that falling prices are the natural signature of a productive economy, and that sound money simply lets you see it.
The Keynesian bargain
John Maynard Keynes published The General Theory of Employment, Interest and Money in 1936, in the wreckage of the Depression. His core insight concerned demand. In the short run, total spending drives output, and wages and prices resist falling when spending drops. If households and firms sit on cash instead of spending it, factories idle and workers lose jobs, and those workers then spend less still. Keynes called one version of this the paradox of thrift: the prudence that saves a single family can sink a whole economy when everyone practices it at once.
Irving Fisher added the second half of the fear in 1933 with his debt-deflation theory. Falling prices raise the real weight of every dollar owed. Borrowers sell assets to cover loans, the selling pushes prices lower, and the debt grows heavier as the borrower works to pay it down.
Put those two ideas together and you get the modern central bank's first commandment: never let prices fall. The Federal Reserve made the rule explicit in January 2012 with a formal 2 percent inflation target. At 2 percent a year, a dollar loses half its purchasing power in about 35 years. That erosion is not a policy failure. It is the policy.
Keynes knew exactly what this meant for savers. In the closing chapter of the General Theory he wrote approvingly of "the euthanasia of the rentier," the slow death of anyone who lives off the return on stored capital. The bargain was plain from the start. Society accepts a permanent, gentle tax on holding money in exchange for insurance against the spiral.
What technology does to prices
Here is the problem with the bargain. A productive economy pushes prices down on its own, every day, and the reason is not demand collapse. It is ingenuity.
The Bureau of Labor Statistics price index for televisions fell 94 percent from December 1997 to August 2015 while the sets got larger and sharper. Solar photovoltaic costs fell about 90 percent across the 2010s. The phone in your pocket carries more computing power than the machines that ran NASA's Apollo program, at a price a teenager can cover with a summer job. Every technology curve bends the same way. Better tools make the same output cheaper, and a competitive market passes the savings to the buyer.
That is good deflation. Economists separate it from the bad kind, and the historical record supports the separation. In 2004 Andrew Atkeson and Patrick Kehoe of the Minneapolis Fed studied more than a century of data across 17 countries and counted 73 episodes of deflation. Sixty-five of them came with no depression at all. A 2015 Bank for International Settlements study by Claudio Borio and colleagues, covering up to 38 economies from 1870 to 2013, found only a weak link between falling goods prices and falling output, and most of that link came from the Great Depression. In the postwar years, growth ran higher in deflation years than in the rest: 3.2 percent against 2.7. The damage traced to collapsing asset prices, property above all, and to the private debt stacked on top of them.
The United States lived this directly after the Civil War. From the early 1870s to the mid-1890s the general price level drifted lower for two decades while American industrial output and rail mileage grew rapidly. Prices fell because the economy got better at making things.
Now hold that against a 2 percent target. If technology alone pushes prices down 1 or 2 percent a year, the central bank has to create enough new money to overcome that decline before it even reaches its target. The productivity gains do not vanish. They get absorbed, and the new money flows first to the people nearest the spigot: banks, bond holders, asset owners. Richard Cantillon described that sequence in an essay written around 1730, two centuries before Keynes.
Where does the money land? Look at the house. The broad U.S. money supply more than doubled between 2010 and 2025. A 2010 house did not become 83 percent better by 2026. Land scarcity and zoning explain part of the rise, and honesty requires saying so. The rest is the measuring stick shrinking.
A market is a measuring device
Strip away the ideology and a market is an instrument. Prices carry information about scarcity, cost and demand from millions of people who never meet. The unit of account is the ruler every one of those signals rides on.
When the ruler shrinks 2 percent a year, and faster in the bad years, every signal picks up noise. A business owner cannot tell whether revenue grew because customers wanted more or because the dollar bought less. A saver cannot hold cash without losing ground, so he buys assets he does not understand just to stand still. A home becomes a retirement account instead of a place to live. None of these distortions show up in a single price. They show up in the whole shape of the economy.
A money with a fixed supply does the opposite. It lets technology's gains arrive as lower prices, and it leaves the signal clean. That is the claim Bitcoin tests in public, block by block, with a hard cap of 21 million coins and an issuance schedule no committee can vote to change.
The house, priced two ways, every year since 2010
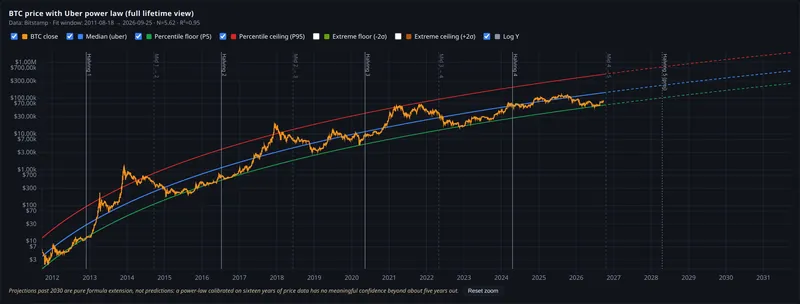
The table below prices the median U.S. house at the end of every year since 2010, once in dollars and once in bitcoin. The house figure is the Census Bureau's fourth-quarter median for each year; the coin figure is Bitcoin's December 31 close. The 2026 row uses the second-quarter median and this week's price.
| Year | Dollars per house | Change in dollars since 2010 | Bitcoin close | Bitcoin per house | Change in bitcoin since 2010 |
|---|---|---|---|---|---|
| 2010 | $224,300 | baseline | $0.30 | 747,667 | baseline |
| 2011 | $221,100 | down 1% | $4.61 | 47,961 | down 93.6% |
| 2012 | $251,700 | up 12% | $13.53 | 18,603 | down 97.5% |
| 2013 | $273,600 | up 22% | $754 | 363 | down 99.95% |
| 2014 | $298,900 | up 33% | $320 | 934 | down 99.88% |
| 2015 | $302,500 | up 35% | $431 | 703 | down 99.91% |
| 2016 | $310,900 | up 39% | $964 | 323 | down 99.96% |
| 2017 | $337,900 | up 51% | $14,156 | 23.9 | down 99.997% |
| 2018 | $322,800 | up 44% | $3,743 | 86.2 | down 99.989% |
| 2019 | $327,100 | up 46% | $7,194 | 45.5 | down 99.994% |
| 2020 | $338,600 | up 51% | $29,002 | 11.7 | down 99.998% |
| 2021 | $414,000 | up 85% | $46,306 | 8.94 | down 99.9988% |
| 2022 | $442,600 | up 97% | $16,548 | 26.7 | down 99.996% |
| 2023 | $423,200 | up 89% | $42,265 | 10.0 | down 99.9987% |
| 2024 | $419,300 | up 87% | $93,429 | 4.49 | down 99.9994% |
| 2025 | $412,300 | up 84% | $87,502 | 4.71 | down 99.9994% |
| 2026 (Sept. 24) | $410,700 | up 83% | $84,385 | 4.87 | down 99.9993% |
Read the dollar column first. It climbed in ten of sixteen years, nearly doubled at the 2022 peak, and sits 83 percent above where it started. A dollar saved in 2010 buys 45 percent less house today.
Now read the bitcoin column. The 4.53 million figure that opened this essay came from the first exchange trade in July 2010. By December the coin had risen sixfold, and the house cost three-quarters of a million coins. By the end of 2012, weeks after the first halving, it cost about 18,600. By the end of 2017 it cost 24. Today it costs just under five, or 487 million satoshis. A bitcoin saved in 2010 buys roughly 150,000 times more house today.
Look closer and the bitcoin column tells a second story. It does not fall in a straight line. The house got more expensive in coin terms in 2014, 2018, 2022 and 2025, and each of those was a down year for Bitcoin. But line up the bad years against each other. At the close of the 2014 bear year the house cost 934 coins. At the close of 2018 it cost 86. At the close of 2022 it cost 27. Every bear-market year priced the house in fewer coins than the bear-market year before it, and by a wide margin. The dollar column shows no such pattern. Its bad years for the buyer, 2021 and 2022, set new highs.

Two honest caveats belong beside that table.
First, nobody bought a house with 747,000 bitcoin in 2010. The market could not have absorbed a sale that size, and the early collapse in the coin price of a house reflects monetization, the world discovering a new money and pricing it up from nothing. That phase does not repeat. The steady-state version of this curve will run slower.
Second, the path is violent. At the October 2025 high near $126,000 the house cost about 3.2 coins; today it costs 4.87, a 50 percent jump in eleven months. A money still in its monetization phase does not feel sound week to week. The claim here rests on the trend across cycles, and on that measure the record has not wavered.
The Keynesian objection, taken seriously
The strongest case against a deflationary money deserves a fair hearing, because Keynesians would make it well.
Their first argument is hoarding. If money gains value every year, people will stop spending and the economy will stall. The evidence cuts the other way in everyday life. Consumers know next year's phone will cost less and do more, and they buy phones every year anyway. People eat, heat their homes and replace a failing car regardless of where the price level sits. What a hard money changes is the hurdle rate for investment. A project has to beat simply holding the money. That weeds out the marginal ventures that only pencil out when cash loses 2 percent a year sitting still, and a Bitcoin holder would call that discipline, not paralysis.
Their second argument is debt, and here they have a real point. Falling prices hurt borrowers. An economy built on a mountain of dollar debt would suffer badly in a rapid shift to deflation, and anyone who waves that away is selling something. The Bitcoin answer is that a hard-money economy would carry far less debt in the first place, because lending would have to compete with a money that earns its keep by existing. That describes a destination. The road from here to there would hurt those who owe the most.
Their third argument is the shock absorber. A central bank can print in a panic, backstop banks and keep credit flowing. A fixed-supply money cannot. In 2008 and 2020 that power arguably prevented worse outcomes, and a system without a lender of last resort would have to find stability somewhere else, through more equity, less borrowed money and banks that hold their reserves. Keynesians consider that a fatal weakness. Bitcoiners consider the printing press the source of the borrowing binges it later rescues. The record of the past century gives both sides ammunition.
Where the math points
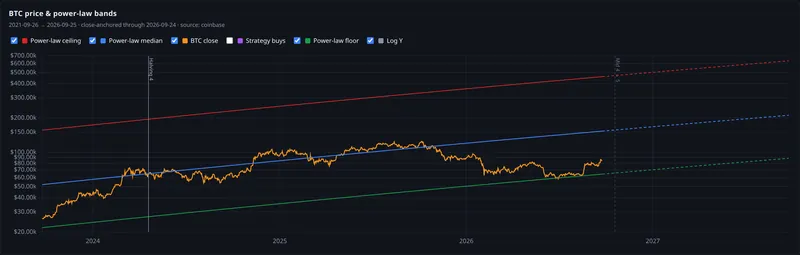
The Hashpoint dashboard tracks Bitcoin against a power-law envelope: a median trend line and a floor line drawn beneath the coin's historical lows. As of this week the median sits near $153,000 and the floor near $64,000. Bitcoin at $84,385 trades at 0.55 times the median.
Carry both lines forward and let the median house keep rising at its 2010 to 2026 pace of 3.9 percent a year in dollars. The table below shows what the model's own lines imply, with the dollar price of the house beside the coin price. These are structural reads of where the envelope sits on each date, not calls on where price will trade.
| Year | Dollars per house (3.9%/yr) | Power-law median | Bitcoin per house at median | Power-law floor | Bitcoin per house at floor |
|---|---|---|---|---|---|
| 2028 | about $444,000 | about $267,000 | 1.66 | about $112,000 | 3.96 |
| 2030 | about $479,000 | about $470,000 | 1.02 | about $198,000 | 2.42 |
| 2032 | about $517,000 | about $790,000 | 0.65 | about $332,000 | 1.56 |
| 2035 | about $581,000 | about $1.59 million | 0.37 | about $668,000 | 0.87 |
| 2040 | about $704,000 | about $4.35 million | 0.16 | about $1.83 million | 0.39 |
On that path the dollar column keeps doing what it has always done: it rises another 71 percent by 2040. On the median line, one bitcoin buys a median American house around 2030. On the floor line, the crossing arrives in the mid-2030s. By 2040 the median line prices the house at about 16 million satoshis, a sixth of a coin.
The power law is a description of the past sixteen years, not a law of physics, and it can break. Adoption can stall. A regulatory shock or a flaw in the protocol could bend the curve. The supply side, though, needs no model. Block 968,369 printed this week, 61 percent of the way through the current halving cycle. New issuance runs about 0.8 percent a year today and drops to about 0.4 percent at the April 2028 halving. The dollar has no such schedule, and the Fed's own target guarantees it never will.
The Hashpoint read
Keynes built a framework for an economy in crisis and the world adopted it as a permanent operating system. Its central promise was that gently rising prices would keep people spending and working. Its central cost was that every saver would lose ground forever, by design, while technology kept making everything cheaper underneath the printing.
Bitcoin removes the printing and lets you watch what remains. Sixteen years of year-end data show a house that cost 747,667 coins, then 18,603, then 24, then 4.87. Over the same sixteen years the dollar price went from $224,300 to $410,700. The house did not change. The ruler did, in both columns, in opposite directions.
A sound money does not make things cheaper. Human ingenuity does that. A sound money simply refuses to hide it.
Data: U.S. Census Bureau and HUD, Median Sales Price of Houses Sold for the United States (FRED series MSPUS; fourth-quarter medians 2010 through 2025, Q3 2010 $224,100, Q2 2026 $410,700); Bitcoin December 31 closes via StatMuse for 2010 through 2025 (2010 through 2012 reflect Mt. Gox-era trading); Clark Moody (first Mt. Gox trade, July 17, 2010, and supply at that block height); CoinCodex and Bitbo (October 2025 high); Bitcoin Hashpoint dashboard (v4/current, price $84,385.46 as of September 24, 2026; power-law bands); Atkeson and Kehoe, "Deflation and Depression: Is There an Empirical Link?" (American Economic Review, 2004); Borio, Erdem, Filardo and Hofmann, "The Costs of Deflations: A Historical Perspective" (BIS Quarterly Review, March 2015); BLS, The Economics Daily, "Long-term price trends for computers, TVs, and related items" (October 2015); Our World in Data (solar PV costs); Keynes, The General Theory (1936); Fisher, "The Debt-Deflation Theory of Great Depressions" (Econometrica, 1933). Power-law projections are structural reads of the model envelope, not forecasts. Nothing here is investment advice.
Get the Hashpoint by email twice a week, Wednesday and Saturday: subscribe free, one click to unsubscribe.