The Long Game: The Snake That Eats Its Tail
· Dennis W. Davis
The Long Game is the Hashpoint's essay series: the ideas that play out over decades, not days. Bitcoin Hashpoint, October 17, 2026

A theory has been going around this fall, and it sounds almost too clever to be true. Most of the federal debt, it says, belongs to institutions. A college graduate does not keep a stack of Treasury notes in a drawer. Pensions, retirement funds and big institutions own it. So as the bond market bends, and starts to look like it might break, the damage lands on them, and the fallout turns into a tailwind for asset prices.
Test that theory against the record and it gets the details wrong. Sort the holders a different way, though, into the foreigners and everyone else, and a stranger picture comes out. The United States owes most of its debt to itself. It borrows from Americans to pay Americans interest, and it borrows more from Americans to pay that interest. It is a snake eating its own tail.
The 10-year Treasury closed at 5.22 percent on October 8, and the 30-year at 5.60 percent. Federal debt passed $40.3 trillion. This essay follows that snake: who it is made of, what happens to it as yields bend, and what it does if the bond market breaks.
Three dollars in four
The Federal Reserve's Financial Accounts, updated September 11, track who holds every marketable Treasury. The Treasury reports what the government owes its own trust funds. Put them together and sort by one question: is the lender foreign, or American?
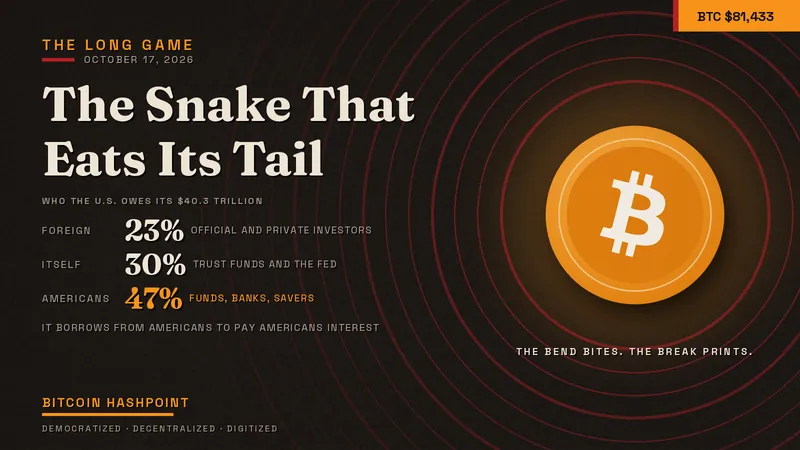
| Who lends to the U.S. government | Amount | Share of $40.3 trillion |
|---|---|---|
| Foreign investors, official and private | $9.27 trillion | about 23% |
| The government itself | about $11.9 trillion | about 30% |
| Social Security and the other federal trust funds | $7.85 trillion | about 19% |
| The Federal Reserve | $4.08 trillion | about 10% |
| American institutions and people | about $19 trillion | about 47% |
| Money market funds | $3.28 trillion | about 8% |
| Households and nonprofits, directly | $2.83 trillion | about 7% |
| Mutual funds and ETFs | $2.55 trillion | about 6% |
| Banks and credit unions | $2.04 trillion | about 5% |
| State and local governments | $1.65 trillion | about 4% |
| All pension funds combined | $1.18 trillion | about 3% |
| All insurers combined | $0.61 trillion | about 2% |
Holder amounts from the Fed's accounts at June 30, 2026, foreign holdings from Treasury's July survey, and the total from October 8. Shares are approximate. The American institutions line includes broker-dealers, government-sponsored enterprises and the debt issued since June.
The original theory missed on the details. Pensions hold about 3 percent, not most of it. Individuals hold about 7 percent directly, and the Fed calculates that line as whatever is left after it counts everyone else.
But the bigger fact sits in the bold lines. The United States owes about 77 percent of its debt to Americans or to itself. The college graduate owns Treasuries after all, inside the money fund that sweeps a brokerage balance, the target-date fund in a 401(k), the bank that holds the deposits, and the Social Security account that pays a retirement someday. Institutions hold the paper. People own the institutions.
The snake
Follow one dollar around the loop and the shape becomes clear.
A worker pays Social Security tax. In the years the program took in more than it paid out, the surplus went to the Treasury, which spent it and handed the trust fund a special bond in return. The trust fund earns interest on that bond, and the Treasury pays it by writing more bonds. Social Security's own reserves stood at $2.56 trillion at the end of 2025, all of it in these IOUs from the government to the government.
The Federal Reserve holds $4.08 trillion of Treasuries, bought with money the Fed created. When the Fed earns more on those bonds than it pays banks on their reserves, it sends the profit back to the Treasury. In the years after 2022, the flow ran the other way: the Fed paid out more than it earned and booked the shortfall as an IOU to itself.
The rest comes from American savings. Money funds, banks, bond funds and insurers buy Treasuries with the deposits, premiums and paychecks of the people whose taxes will one day repay them.
Now the interest. The Congressional Budget Office puts net interest for fiscal 2026 at $1.143 trillion, up 11 percent in a year and more than the $916 billion the Defense Department spent on the military. Roughly a third of the interest on marketable debt flows abroad. The rest stays home, in American funds and banks or at the Fed, and the interest on trust fund debt never leaves the government at all. The government borrows from Americans, pays most of the interest to Americans, and borrows again from Americans to cover the bill.

A loop like this has one strange strength. Foreign lenders can force a government into default when it owes them in a currency it cannot print. Greece learned that inside the euro. A government that owes most of its debt to its own people, in its own currency, never has to default. Its creditors are its own retirees, its own banks, its own pension funds and its own central bank, the institutions any government will move heaven and earth to protect.
So when the loop strains, the pressure does not come out as a default. It comes out through the one valve the snake controls: the value of the dollar.
The bend: the snake bites itself first
A bond market bends when yields climb while the auctions still clear. That is the market of 2026. The theory says the bend helps asset prices. The record says it hurts, and the loop explains why: the losses do not land on strangers.
The losses. When yields rise, every bond already issued loses value. The Fed's own accounts show a gap of $1.86 trillion at the end of June between what the Treasury owes at face value and what holders report the bonds are worth. U.S. banks carried $325.1 billion of unrealized losses on their securities at the end of March. Silicon Valley Bank showed in 2023 where those losses go. They sat quietly on the books until depositors ran, and then they became the bank's failure. Every one of those losses sits on an American balance sheet, owned in the end by American depositors, retirees and fund shareholders.
The discount rate. A higher real yield raises the return every other asset has to beat. The 10-year inflation-protected yield, the real rate, reached 2.87 percent on October 8, up from 2.38 percent on August 24. Bitcoin pays no interest, so it competes with that number directly.

The test case sits four years back. In 2022 the Fed raised rates and real yields jumped. Bitcoin fell 64.2 percent that year. The S&P 500 fell about 18 percent. The broad U.S. bond index fell 13 percent, its worst year on record, and long Treasuries fell 26.1 percent. Nothing escaped the bend.
The interest. The theory's best argument says the snake also feeds itself: higher yields mean more interest paid to American holders, a kind of stimulus. The loop makes that partly true, since most of the interest stays home. But it stays mostly inside money funds, banks and the government's own accounts. When economists went looking for the stimulus in the 2022 to 2024 data, they found personal interest income still below its 2019 share of total income. Households earned more on their savings and paid more on their loans.
So on the way to any break, the bend does damage first, and it does it to Americans.
The break: where the snake reaches for the valve
Now suppose the bend becomes a break. Auctions fail, dealers cannot absorb the selling, prices gap. What then?
The record answers clearly. The central bank buys.

March 2020. In the dash for cash, foreign central banks and U.S. mutual funds sold Treasuries faster than dealers could take them. The New York Fed bought $37 billion on March 13 alone, then more than $1 trillion of Treasuries in four weeks. On March 23 it made the buying open-ended. Rates sat at zero, Congress mailed checks, and over the following year the Fed's balance sheet swelled. Bitcoin went from under $5,000 that March to above $60,000 within thirteen months.
That is the snake reaching for the valve, and it really happened.
September 2022. The 30-year British gilt yield rose 1.3 percentage points in three trading days, three times faster than any move on record. Pension funds that had borrowed to hedge their liabilities faced collateral calls and dumped gilts to meet them. The Bank of England bought £19.3 billion of gilts in thirteen working days and stopped the spiral.
Then it sold every one of them back. The Bank called the purchases financial stability, not monetary policy, restarted its bond sales on November 1 and finished the unwind by January 12, 2023. It kept raising rates the whole time. A break produced a rescue, and the rescue produced no lasting money creation.
Japan. Japan runs the purest version of the snake. Japanese investors hold the large majority of their government's debt, and the Bank of Japan alone owns more than half of it. The Bank capped yields from 2016 to 2024. Japan never came close to default. The yen took the strain instead, losing about a third of its value against the dollar between 2021 and 2024.
A break always brings a buyer. Whether that buyer prints for good depends on whether the central bank has room to give up on inflation, and a snake that owes itself always has a reason to.
Where the United States stands
The American authorities have already started tending the plumbing.
- The Fed ended its balance sheet runoff on December 1, 2025, and has bought Treasury bills since mid-December to keep bank reserves ample. Its bill holdings rose by $365 billion in a year.
- Bank regulators eased a capital rule for the largest banks on April 1, 2026, which frees them to hold more Treasuries.
- The Treasury doubled the size of its long-bond buybacks from September 9, to at least $4 billion per operation.
But on September 16, the Fed voted 12 to 0 to raise its policy rate to a range of 3.75 to 4.00 percent. Inflation ran 3.4 percent in August. That mix looks far more like London in 2022 than New York in 2020: plumbing repairs alongside a tighter policy rate.
The models that split the 10-year yield into its parts agree. They put the term premium, the extra pay investors demand for holding long debt, somewhere between 0.8 and 1.1 percent. Most of this year's rise comes from the expected path of the Fed's own rate. A true buyers' strike would show up first as a spike in that premium, and it has not come.
The case for the snake
The argument for this view goes like this. A government that owes three dollars in four to its own people and its own institutions cannot let its bond market fail, because the bond market is its people's savings. It cannot default without breaking its own banks, pensions and retirees. Interest above a trillion dollars a year grows with every rollover, and the government pays it by borrowing from the same people again. Sooner or later the loop forces a choice between the inflation target and the bond market, and a government whose creditors are its own voters picks the bond market. Japan already shows the path. The money created to close the loop will chase scarce assets, and nothing is scarcer than a fixed supply of 21 million coins.
The case against
The other side carries the weight of the recent record.
First, the bend comes before any break, and the bend hurts. In 2022 bitcoin lost about two thirds of its value before the cycle turned. An investor who bets on the break has to survive the bend.
Second, a backstop does not mean debasement. The Bank of England proved in 2022 that a central bank can rescue a bond market and take the money back out within months.
Third, a loop can run for a very long time. Japan's has run for decades with slow, grinding losses for savers rather than a sudden break.
Fourth, the foreign quarter still sets the margin. Foreign holders own about 23 percent of the debt, and the marginal seller moves the price. A loop that owes itself can still bend hard when outsiders step back.
Fifth, the Fed is raising rates, not cutting them. Fiscal dominance arrives only when a central bank chooses the bond market over its inflation target, and in September this one chose the target. The gains from any debasement also show up in dollars, not in real wealth.
What to watch
These signals show whether the bend turns into a break, and none of them needs a date.
- The term premium. A jump well above 1 percent would mean investors are refusing to hold long debt at any price the Fed's path implies.
- Auction tails and foreign demand. Long-bond auctions that clear well above expected yields, or a falling foreign share in Treasury's monthly survey, show the outside buyers thinning out.
- The Fed's purchases. A move from bills into longer Treasuries, which the September directive already allows for maturities out to three years, would mark the shift from plumbing to price support.
- The policy rate. Cuts while inflation runs above 3 percent would mean the Fed has picked the bond market.
- The real yield. The 10-year inflation-protected yield at 2.87 percent works against bitcoin. A sustained fall while inflation holds up is the condition the snake needs.
The Hashpoint read
The theory started from a true observation and took a wrong turn. Pensions do not hold most of the debt. But sort the holders into foreign and American, and the real structure appears: the United States owes about three dollars in four of its debt to Americans or to itself. It borrows from its people to pay its people interest, and borrows again to cover it.
That loop explains both halves of the story. The bend hurts because every loss lands on an American balance sheet, and 2026 is still a bend. The break prints because a government that owes itself will not default on its own retirees and banks. It reaches for the one valve it controls, and that valve is the currency.
Bitcoin sits outside the loop. It is nobody's liability, it pays no interest, and no central bank can print more of it. That makes it the cleanest expression of the break, and a painful thing to hold through the bend. The term premium, the Fed's purchases and the real yield will say which one the snake is in.
Data: Board of Governors of the Federal Reserve System, Financial Accounts of the United States (Z.1), table F3.2.s, Treasury securities by holder, release of September 11, 2026, data through the second quarter of 2026 (household residual method; valuation discrepancy of $1,864.7 billion); Federal Reserve H.4.1, week ended October 7, 2026; Federal Reserve H.15, October 8, 2026 (10-year 5.22%, 30-year 5.60%, 10-year TIPS 2.87%); U.S. Treasury TIC Table 5, July 2026 (foreign holders); total public debt of $40,305.3 billion and intragovernmental holdings of $7,851 billion on October 8, 2026, from Treasury's Debt to the Penny as reported by PrimeRates; Social Security trust fund reserves of $2,561.3 billion at the end of 2025 (2026 Trustees Report, via the Congressional Research Service); Congressional Budget Office, Monthly Budget Review for September 2026, October 8, 2026 (net interest $1,143 billion; Defense Department military outlays $916 billion); FDIC Quarterly Banking Profile data for the first quarter of 2026 as reported June 22, 2026 (unrealized securities losses $325.1 billion); Federal Reserve review of Silicon Valley Bank, April 28, 2023; New York Fed, Nathaniel Wuerffel, "Lessons from the Market Functioning Purchases of Early 2020," March 3, 2023, and Liberty Street Economics, "The Global Dash for Cash in March 2020," July 12, 2022; Bank of England Quarterly Bulletin, 2023 (gilt market operation of September 28 to October 14, 2022, and its unwind); Bloomberg, March 18, 2024 (end of Japan's yield curve control); yen exchange rates, 2021 to 2024; FOMC statements of October 29, 2025 and September 16, 2026; OCC Bulletin 2025-41 (the eSLR rule, effective April 1, 2026); U.S. Treasury buyback announcement, August 19, 2026; FRED, Kim-Wright 10-year term premium, October 2, 2026; NY Fed ACM term premium as mirrored, September 30, 2026; Paul Kasriel on personal interest income, 2022 to 2024; 2022 annual returns from DQYDJ (bitcoin), Bloomberg U.S. Aggregate, the Ibbotson long-term government bond index and the S&P 500; Bitcoin Hashpoint dashboard (August 2026 CPI of 3.4% year on year; bitcoin price history for March 2020 to April 2021). Research memo: hashpoint-research/2026-10-13-who-holds-the-debt-v1.md. Market figures as of October 8 to 13, 2026, refresh on publication. Structural reads, not forecasts. Nothing here is investment advice.
Get the Hashpoint by email twice a week, Wednesday and Saturday: subscribe free, one click to unsubscribe.