The Long Game: You Are Here
· Dennis W. Davis
The Long Game is the Hashpoint's essay series: the ideas that play out over decades, not days. Bitcoin Hashpoint, September 27, 2026

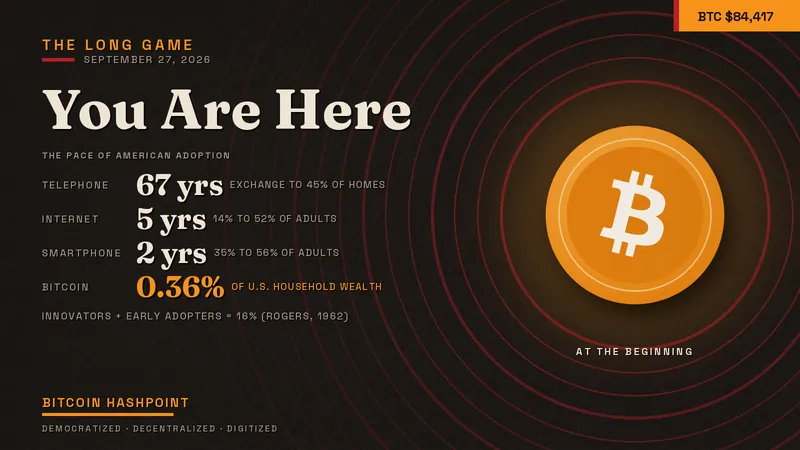
There is a chart that makes the rounds every cycle. A century of American technology adoption, one colored line per invention, each climbing from zero toward the top of the frame. The telephone crawls up the left side for decades. Electricity and radio follow. On the far right, the lines stop crawling and start standing straight up. And at the bottom right corner, barely off the floor, sits a small orange coin with a label: You Are Here.
That label is the most honest thing on the chart, and the most misread. People see seventeen years of Bitcoin headlines and assume the coin must be halfway up its line by now. It is not. Measured the way you would measure a new money, by the capital people have actually committed to it, Bitcoin's adoption has barely begun. On the telephone's clock, the patent sits on file and the first commercial calls went through a couple of years ago.
This edition also introduces a new section of the Hashpoint dashboard, built to answer the question that chart raises: if Bitcoin climbs its S-curve, what does the climb look like in dollars, and what has to happen first?
The telephone's clock
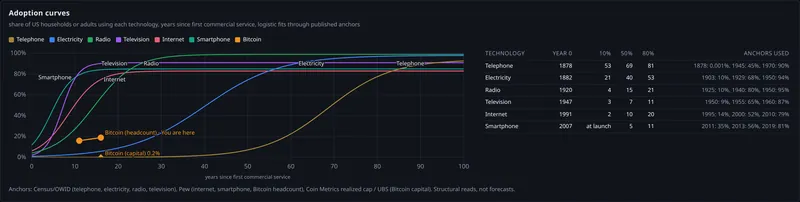
Alexander Graham Bell patented the telephone in 1876. For two years it was a demonstration piece, shown in lecture halls and on a few private lines strung between offices. Then on January 28, 1878, the District Telephone Company of New Haven opened the world's first commercial telephone exchange in the Boardman Building. It had 21 subscribers, each paying $1.50 a month.
That exchange is where the telephone's adoption curve really starts. Before it, people had seen the device. After it, people paid for it and used it for something ordinary. From that first exchange, the telephone took until 1945 to reach 45 percent of American households. Sixty-seven years from the first commercial call to not quite half the country.
Now set Bitcoin on the same clock. Satoshi Nakamoto published the white paper in 2008 and mined the genesis block in January 2009. The first exchange trade on Mt. Gox came in July 2010, 20 coins at about a nickel each. Those years are Bitcoin's patent and its lecture-hall demonstrations. For most of the next decade the network ran and the price climbed while ordinary savers watched it the way people in 1877 watched a telephone at an exhibition.
Bitcoin's first commercial calls came in January 2024, when the spot ETFs opened. For the first time, a retiree could buy Bitcoin through the same brokerage account that holds an index fund, with a familiar name on the statement and no private key to lose. That is the Boardman Building moment. As of this week, Bitcoin's commercial era is two years and eight months old.
Trying it is not adopting it
The surveys make Bitcoin look further along than it is, because most of them measure contact rather than commitment.
| Source | Question asked | Reading |
|---|---|---|
| Pew Research, January 2026 | Ever invested in, traded or used crypto | 19% of adults (16% in 2021) |
| River, July 2026 | Estimated Bitcoin owners, including fund exposure | 18.6% of adults, about 49.6 million people |
| Gallup, June 2026 | Own cryptocurrency | 9% of adults (14% in 2025) |
| Federal Reserve household survey, 2025 | Used or held crypto during the year | 10% of adults |
Every reading lands between 9 and 19 percent of adults, right around the 16 percent line where Everett Rogers placed the end of the early adopters in 1962 and where Geoffrey Moore placed his chasm in 1991. By headcount, Bitcoin looks like a technology stuck at the edge.
But those numbers count people who picked up the receiver. The Fed's Survey of Consumer Finances found in 2022 that the median crypto holding among the households that had any was $2,000, somewhere between a twentieth and an eighth of a coin at that year's prices. Payments use has stayed under 3 percent of adults since 2021. A person with $2,000 of something they bought once has tried it. For a money, adoption means holding a meaningful share of your wealth in it.
Count the money, not the heads
So count the money.
Start with American households. River estimates that Americans, counting individuals together with funds and companies, hold about 42 percent of all bitcoin, roughly 8.4 million of the 20.09 million coins mined. At Friday's close near $84,100, that is about $709 billion. The Federal Reserve put American household and nonprofit net worth at $195.9 trillion at the end of the second quarter. Every American-held coin together comes to about 0.36 percent of it, and that figure is generous, because it counts company and fund coins as though households held them directly.
Now go global, and go one layer deeper. Market price tells you what the last trade said a coin was worth. Realized capitalization tells you something harder: it values every coin at the price it last moved on chain, which makes it the closest thing on-chain data offers to the actual dollars people have put into Bitcoin and left there. The dashboard reads it from Coin Metrics community data every day. As of Friday it stood at $1.08 trillion.
Against global wealth of about $517 trillion, per the UBS Global Wealth Report, that is about 0.2 percent. Gold, the asset Bitcoin most often gets measured against, holds roughly 6 percent. Bitcoin's committed capital sits at about one-thirtieth of gold's share of the world's wealth.

That is what You Are Here means, measured in money. By headcount, Bitcoin brushes the chasm. By capital, it has not left the first two and a half percent of the curve.
The new section: the S-curve in capital
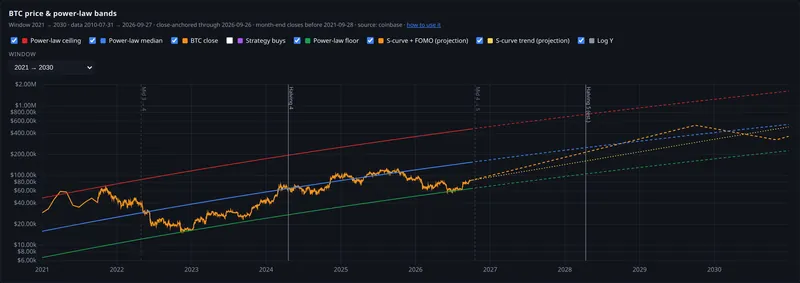
The Hashpoint dashboard has always carried a power-law model: a floor, a median and a ceiling that have framed Bitcoin's price since 2011. The power law works beautifully looking back. Looking forward, it has a problem. Run the median line out far enough and it claims more than all the wealth on Earth. The line has to bend somewhere, and price history alone cannot tell you where.
The new S-Curve and FOMO section on the dashboard puts that bend on the screen and hands the reader the controls. It grows Bitcoin's realized capital along an S-curve, the same way the internet and the smartphone spread, and it rides the four-year cycle of fear and greed on top. Four choices drive it.
- Capital ceiling. The share of global wealth Bitcoin's committed capital tops out at. Gold sits near 6 percent. The dashboard offers a range of ceilings, 10 and 20 percent among them.
- Adoption pace. How fast the curve climbs once it bends upward. Internet pace uses the American climb from 14 to 52 percent of adults between 1995 and 2000. Smartphone pace uses 35 to 56 percent between 2011 and 2013. Survey pace uses Bitcoin's own flat line from 2021 to 2026.
- FOMO cycle. How far price runs above committed capital at each cycle top. The dashboard measures that with MVRV, market value over realized value. The 2024 setting repeats the last cycle's froth; the 2021 setting brings back the cycle before it.
- Inflation. At 3.4 percent, the latest annual CPI reading, global wealth grows faster in dollars than at the Fed's 2 percent target, so the dollar ceiling sits higher.
Pick the four, and the chart draws a path to the last coin, around 2140, with a card for each cycle top.
What the cards show
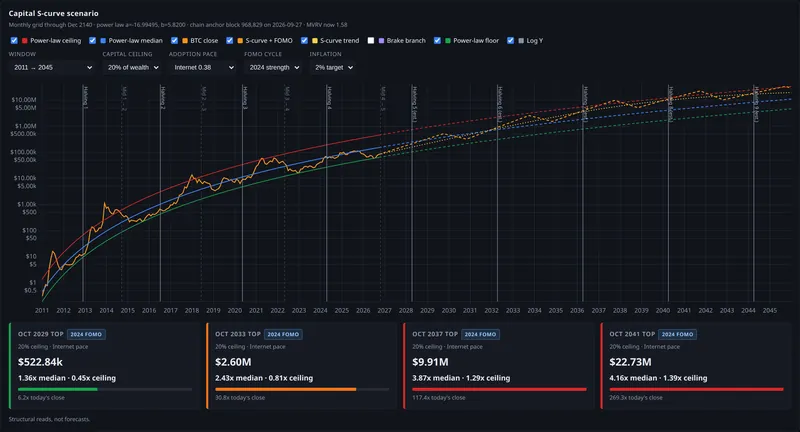
Here are two settings side by side, both with a 20 percent ceiling and last cycle's FOMO strength. The first uses internet pace with 2 percent inflation. The second uses smartphone pace with inflation at 3.4 percent.
| Cycle top | Internet pace, 2% inflation | Smartphone pace, 3.4% inflation |
|---|---|---|
| October 2029 | $523,000, 1.37x the power-law median | $637,000, 1.66x the median |
| October 2033 | $2.60 million, 2.43x the median | $3.90 million, 3.65x the median |
| October 2037 | $9.92 million, 1.29x the power-law ceiling | $15.67 million, 2.04x the ceiling |
| October 2041 | $22.74 million, 1.39x the ceiling | $32.60 million, 1.99x the ceiling |
Two things jump out. First, a calendar-time S-curve does not bend the power law down; it pushes price above it. The steep middle of adoption lies ahead, so the path climbs through the median, then through the ceiling, and runs above the old envelope for about a decade before capital approaches its ceiling and the line flattens.
Second, nothing in that table is a forecast. Each card is arithmetic on four assumptions, and the section says so directly under the cards. Change the ceiling to 6 percent at internet pace and the smooth trend never clears the median at all. Slow the pace to Bitcoin's own survey trend and no ceiling gets you there.
The branch decider: capital pace
So which branch is Bitcoin on? The dashboard answers with one number: the pace at which realized capital must grow every year until the October 2029 top for the chosen path to hold.
Under the internet-pace setting above, that pace is 52.6 percent a year. Under the smartphone setting, 62.5 percent. Here is what realized capital has actually done, measured in four-year stretches ending each May:
| Period | Realized capital growth per year |
|---|---|
| 2014 to 2018 | 116% |
| 2018 to 2022 | 49% |
| 2022 to 2026 | 24% |
| Needed from here, internet pace | about 53% |
Realized capital grew 0.4 percent over the past twelve months and sits 3.5 percent below its October 2025 high. The hump branch needs roughly double the last cycle's pace, starting from a standstill.
Two more panels in the section show the same pressure from different angles. Capital coverage, realized capital per dollar of the power-law median's market value, has fallen at every cycle low: 1.08 in January 2015, 0.87 in December 2018, 0.55 in November 2022, and 0.35 now. For price to sit on the median today, MVRV would need to reach 2.87, above the last cycle's peak of 2.78. And FOMO itself keeps shrinking. MVRV peaks ran 7.74, 5.88, 4.72, 3.96 and 2.78 across the five cycles on record, while the troughs rose from 0.39 to about 1.10. Each cycle, price runs less far ahead of the money underneath it.
Read plainly, the power law has been living on froth that thins every cycle. The next leg of the long game has to come from committed capital, not from froth. That is exactly what an S-curve in its steep middle supplies, and exactly what the data has not shown yet.
The supply side is already moving
Demand is flat. Supply is not.
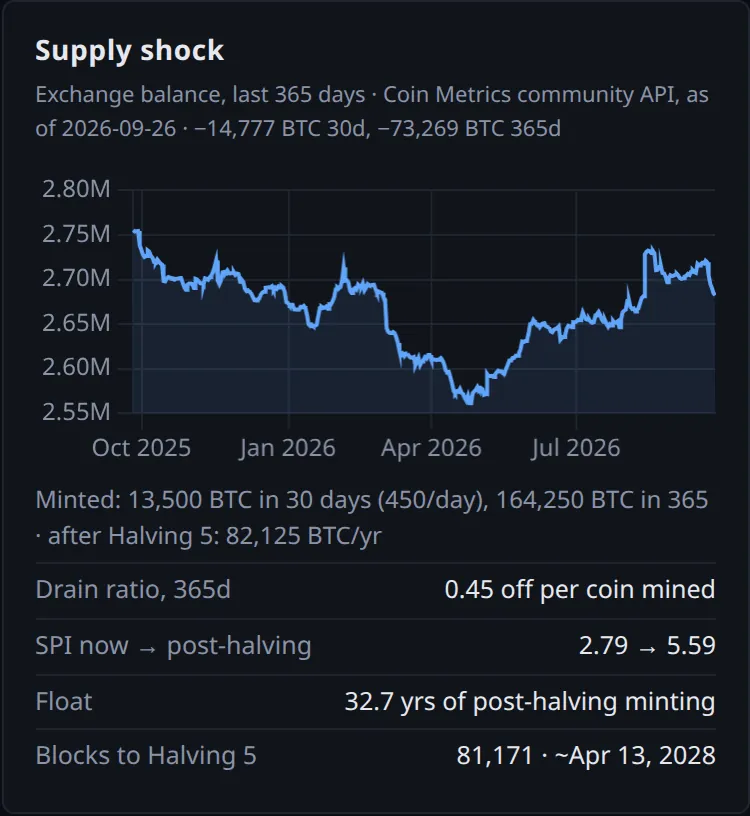
The section's supply-shock panel tracks how many coins buyers pull off exchanges for every coin the network mints. Over the past 365 days, exchange balances fell by 73,269 BTC while miners produced 164,250, a drain of 0.45 coins for every coin minted. Over the last 30 days, exchanges gave up 14,777 BTC against 13,500 minted. The exchange float stands near 2.68 million coins, about 32.7 years of issuance at the post-halving rate.
That rate arrives soon. The fifth halving sits 81,171 blocks out, around April 13, 2028, and it cuts new supply from about 164,000 coins a year to about 82,000. The supply-pressure index, institutional accumulation against issuance, reads 2.79 today. At constant demand, the halving alone lifts it to 5.59.
That is the one place the machinery is already turning, and it gets its own Long Game soon: The Great Supply Shock.
The tripwires
The last panel in the section is a checklist. Stock2FOMO is the name for the case where the dollar breaks and Bitcoin's price leaves the power law upward rather than bending under it. The dashboard lists the six conditions that would show that case arriving, and it lights each one when the data crosses the line.
| Tripwire | Reading, September 26 | Status |
|---|---|---|
| 10-year real yield below zero with CPI above 2% | Real yield +2.85%, CPI 3.4% | Not lit |
| 30-year yield rising while the dollar index falls | 30-year +29bp, DXY +1.1% | Not lit |
| Realized capital growth above 24% over 12 months | +0.4% | Not lit |
| MVRV above the last cycle peak of 2.78 | 1.58 | Not lit |
| Capital coverage back above 0.50 | 0.35 | Not lit |
| Supply-pressure index above 3 with exchange supply falling | 2.79, exchanges down 14,777 BTC in 30 days | Watch |
Five dark, one on watch, and the one on watch is the supply side. It brushed the line once this week: the index printed 3.02 on the September 25 reading and fell back to 2.79 the next day as its 30-day window rolled forward. That is what a tripwire on watch looks like from up close.
What the curve does to the share
The S-curve meets one feature no other line on that adoption chart ever had: a fixed supply. When the telephone reached more homes, the phone company strung more wire. Bitcoin's cap stays at 21 million no matter how many people arrive.
Hold the American share of all coins at today's 42 percent and run the headcount up the curve:
| American adults holding Bitcoin | Coins per holder, on average |
|---|---|
| 18.6% (today, River's estimate) | about 0.17 |
| 50% | about 0.063 |
| 80% | about 0.040 |
The average American stake, measured in coins, gets smaller as adoption rises. That is simple division, and the only variable in it free to move is the price of each coin. Split every mined coin evenly among the roughly 8.2 billion people on Earth and each one gets about 0.00245 bitcoin. The people holding at the bottom of the curve are not late. They are the first 21 subscribers on the New Haven exchange.
What the curve does not promise
A structural read has to name what could bend the line, in both directions.
The chasm is real, and technologies die in it. The Segway had visionaries. So did the videophone: AT&T showed its Picturephone at the 1964 World's Fair, and the idea stayed out of American homes for four more decades. A commercial launch does not guarantee a commercial climb. The dashboard's own brake branch shows that road: the power law bending into its ceiling without the S-curve ever changing gear.
The other direction matters just as much. Nothing in this section, and nothing in the data, says when the line turns. An S-curve's flat stretch looks identical the year before the turn and the decade before it. The internet sat at 14 percent of American adults in 1995 and 52 percent in 2000, and nothing in the 1994 numbers announced it. Realized capital is flat today and coverage sits at a record low, and both of those facts describe the present. They do not schedule the future. The turn could show up in next month's data or in 2035, and the section is built so that when it comes, the first sign appears in the numbers before it appears in the price: a rolling twelve-month realized capital reading above 24 percent, coverage climbing back through 0.50, the supply-pressure index holding above 3 while exchanges drain. Those are the tripwires, and five of six are dark this week.
And the ceiling itself cannot be read from price history. A 6 percent ceiling and a 20 percent ceiling fit the past sixteen years almost equally well. Same past, different futures. That choice belongs to the reader, which is why the dashboard hands it over.
The Hashpoint read
The chart puts Bitcoin at the bottom right with a label that says You Are Here, and most readers take that as a late position. The data says the opposite. By headcount, between one in ten and one in five American adults have touched it. By committed capital, Bitcoin holds about 0.2 percent of the world's wealth against gold's 6. Its first commercial exchange opened less than three years ago.
The new dashboard section turns that position into a set of roads. On the fast roads, the S-curve lifts price through the power-law ceiling within a decade. On the slow roads, it never clears the median. The decider is realized capital, and it needs to grow at twice last cycle's pace from a standstill. The supply side is already tightening ahead of the 2028 halving. The demand side has not moved yet, and the dials set the shape of the road, never the date the car starts moving. The dashboard cannot tell you when the line turns. It can tell you the morning after it does.
That is the long game. The patent sits on file and the first calls have gone through. Someone is wiring the switchboard for a crowd that has not arrived. You are here, at the beginning, and the dashboard now shows every road out.
Data: Bitcoin Hashpoint dashboard, S-Curve and FOMO section (September 26, 2026 readings unless noted: daily close $84.42k vs power-law median $153.63k; realized cap $1.08T; MVRV 1.58; capital coverage 0.35; supply-shock panel; tripwires; September 25 readings for the cycle-top cards and the capital pace needed, 52.6%/yr at internet pace with 2% inflation and 62.5%/yr at smartphone pace with 3.4%); Coin Metrics community API (realized cap, MVRV, supply, exchange balances); UBS Global Wealth Report 2026 (global wealth $517T at end-2025); World Gold Council (above-ground stock, gold near 6% of global wealth); Federal Reserve Financial Accounts Z.1, September 11, 2026 (household and nonprofit net worth $195.9T); River, July 7, 2026 (49.6 million owners, 18.6% of adults, 42% of all bitcoin); Pew Research Center (crypto use 2021 and 2026; internet access 1995 and 2000; smartphone ownership 2011 and 2013); Gallup (crypto ownership 2025 and June 2026); Federal Reserve SHED 2025 via crypto.news; Federal Reserve Survey of Consumer Finances 2022 via the St. Louis Fed; Connecticut Humanities (first commercial telephone exchange, January 28, 1878); History of the telephone in the United States (1945 household penetration); Clark Moody (first Mt. Gox trade, July 17, 2010); Everett Rogers, Diffusion of Innovations (1962); Geoffrey Moore, Crossing the Chasm (1991). Survey figures measure different questions and are not directly comparable. Scenario paths are arithmetic on reader-chosen assumptions. Structural reads, not forecasts. Nothing here is investment advice.
Get the Hashpoint by email twice a week, Wednesday and Saturday: subscribe free, one click to unsubscribe.